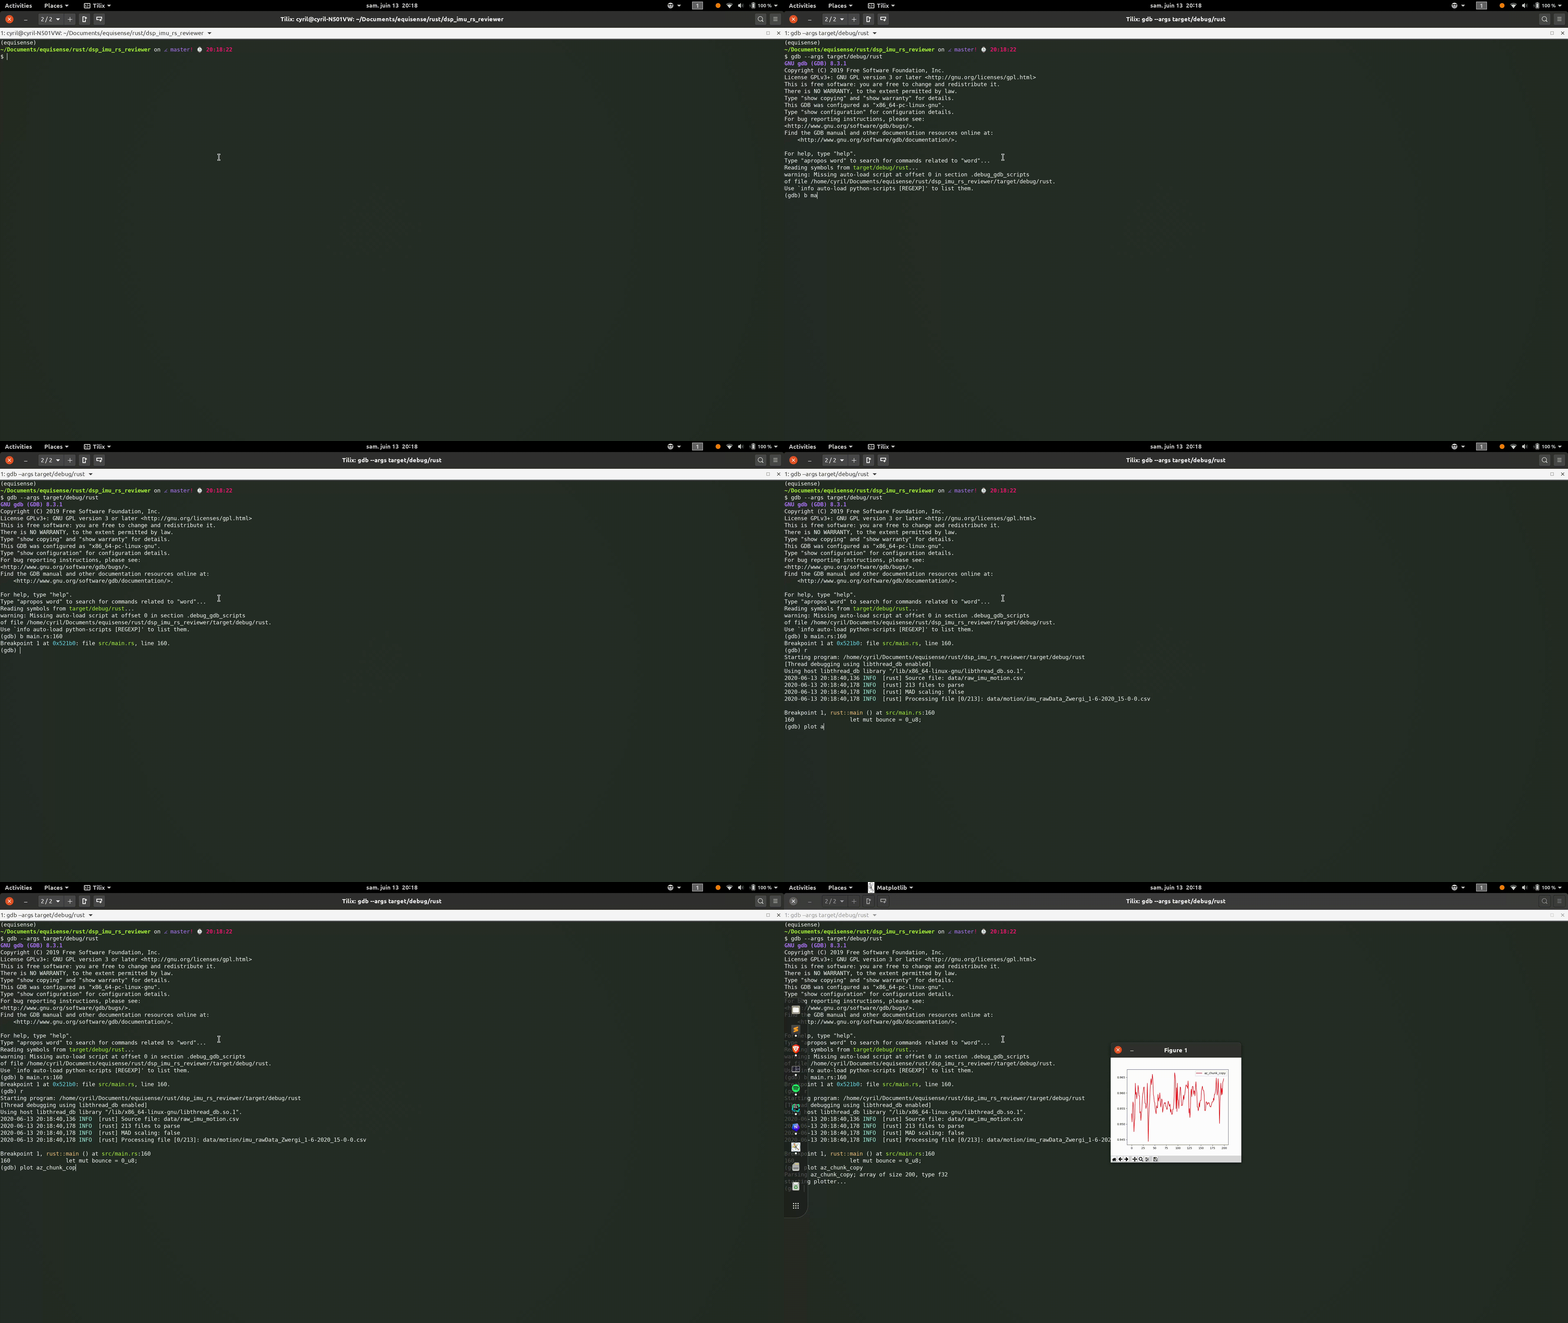
Plot graphs from GDB with gdbunble-plot.
By Cyril on June 22, 2020
As a freelance, I have the chance to work on different parts of embedded projects and during the last few weeks, I have been focused on Digital Signal Processing algorithms written in Rust. As I had to debug my library, I wanted to plot the signal I am working on and its various transformations to see how my algorithm is behaving on the incoming data. When debugging DSP algorithms, this is a repetitive task so I rapidly realized that I needed a script to quickly display the data.

GDBundle
GDBundle is a plugin manager for GDB (and LLDB). It has been introduced by the folks at Memfault recently and makes adding new commands inside GDB an easy and portable task.
Those commands are using pure GDB commands or Python along with GDB’s Python API behind the scene. Using Python for that kind of task is really powerful as it brings the libraries I needed to plot the variables like the famous matplotlib, pretty handy!
I have to admit that I consider myself a beginner with GDB. I mostly use GUI tools like Ozone to debug my programs and I never wrote a GDB script before… which motivated me to write a GDB plugin 😊. It’s never too late.
So I used GDBundle to write my custom command.
GDBundle-Plot
I started by cloning the example repository and built it to see how the plugin is made. There are not many files in the repository so starting to develop its own GDBundle plugin is really easy.
I modified the author and plugin name in pyproject.toml: I named my plugin gdbundle-plot. Then I changed the paths in gdb_loader.py as I changed the script names to reflect the name of my plugin. I decided to remove the .gdb file because it won’t be used at the moment.
The specifications for that plugin are my own: plotting arrays coming from Rust code in a graph. I need to support the Rust types primarily but I also added C types to make it usable by most of us, developers.
GDB’s Python API
I focused my work on GDB instead of LLDB and started modifying the renamed file plot_gdb.py.
The GDB API makes it easy to retrieve a variable using its function parse_and_eval. This function returns an object containing the variable type. The script inspects the type in order to parse correctly the value. If the variable is a reference to an array, the value is dereferenced to access the actual values in the array. So far, I added support for slices declared with the Rust numeric types such an f32, i32, etc.
Another consideration was to make the script run without blocking GDB for too long. As one might want to stay on the figure for a while to inspect it, I had to use multiprocessing and spawn a new process to show the figure.
Usage
That’s pretty simple:
(gdb) plot var_1_name [var_2_name ...]There is the possibility to plot several variables because it is often useful to see how a filter is acting on the buffers for example.
Here is a screencast for you to watch on one of my projects:

What’s next
There are many improvements possible for that plugin. Here are the main ones I would like to improve:
- Collections are currently not supported. I mostly work on embedded devices that don’t have support for collections (
no-std), but I use Rust programs running on my machine to test and debug my libraries quickly and I make use of theVectororHashMapsometimes. I am pretty sure my plugin could be able to handle data from vectors. - If it’s in the readers’ interest, I would love to have the same level of support for both GDB and LLDB.
Conclusion
Finally, you can find the plugin on Github with instructions to install it. I may publish it as a pip library as soon as I find it stable enough and with enough features.
If you are interested in that plugin and want to give it more features, please submit your pull request 🙏.